
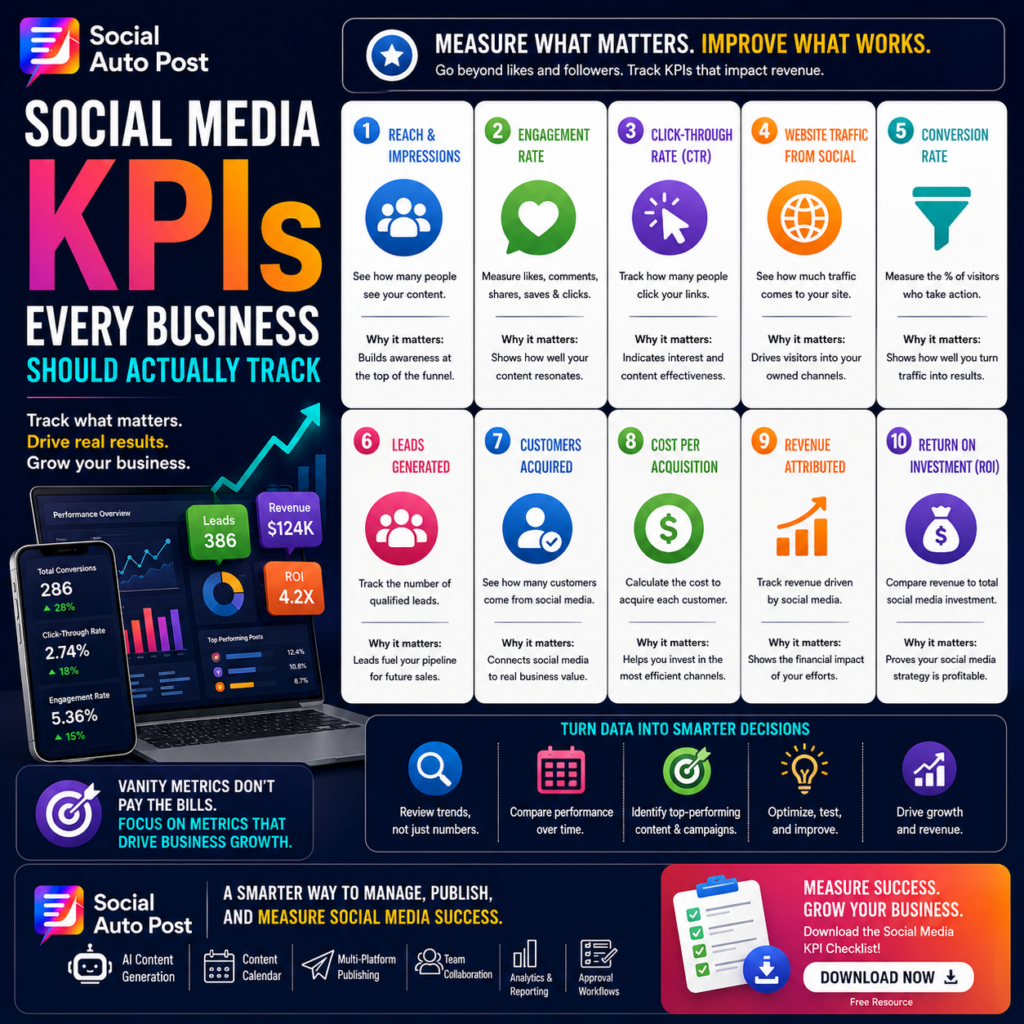
Social Media Metrics: Key KPIs Every Business Should Track
Analyzing social media metrics allows modern marketing teams to connect social activity directly to business revenue. Social media dashboards present hundreds of numbers every day, including followers, likes, impressions, comments, clicks, and reach. However, processing more raw data does not automatically lead to better commercial decisions.
The core challenge isn’t finding data points to display—it’s identifying the social media metrics that demonstrate whether your content strategy contributes to business growth. While a post receiving thousands of likes might generate zero pipeline, a post with modest reach can generate qualified leads and sales. Effective social media measurement must look beyond surface-level statistics to measure true commercial value.
Aligning Social Media Metrics with Core Business Goals
Before reviewing your analytics platform, define what your campaigns are designed to accomplish. Tracking follower growth alone yields little strategic insight if your primary objective is lead acquisition.
| Business Goal | Top-of-Funnel Indicator | High-Intent Social Media Metrics | Commercial Outcome |
| Brand Awareness | Reach & Impressions | Save & Share Rates | Audience Growth |
| Lead Generation | Click-Through Rate (CTR) | Form Submissions & Demo Requests | Cost Per Lead (CPL) |
| Customer Acquisition | Social Referral Traffic | Conversion Rate | Customer Acquisition Cost (CAC) |
| Revenue Growth | Assisted Conversions | Attributed Pipeline Value | Social Media ROI |
According to performance research in the Hootsuite Social Trends Report, over 70% of executive teams evaluate marketing programs based on customer acquisition cost and attributed revenue rather than overall follower counts.
Key Performance Indicators for Modern Marketers
To learn how to draft data-driven captions that encourage clicks, read our breakdown of ai social media captions.
Evaluating High-Intent Engagement Metrics
[Social Impression] ──> [Click-Through (CTR)] ──> [Landing Page Visit] ──> [Attributed Customer]
1. Reach vs. Impression Quality
Reach measures the number of unique individuals who view your content, while impressions record total displays. Use these figures as top-of-funnel indicators, then connect them directly to downstream engagement.
2. High-Intent Actions
Likes provide basic validation, but high-intent interactions yield far better insight into audience interest:
-
Saves: Indicates the viewer considers the resource valuable enough to reference later.
-
Shares: Proves the content was compelling enough to recommend to peers.
-
Comments: Demonstrates active conversation and strong audience connection.
3. Click-Through Rate (CTR) and Referral Traffic
Click-through rate highlights how effectively your copy and creative prompt action. If your CTR is low despite high reach, refine your calls to action, audience targeting, or offer relevance.
Analytics Insight: Last-click attribution often overlooks social media’s role in discovering brands. A user may discover your product on LinkedIn, read an article, subscribe to your newsletter, and convert via organic search weeks later. Always consider assisted conversions when evaluating platform performance.
For details on establishing a streamlined publishing workflow that supports multi-channel tracking, review our guide on educational content marketing.
Execution Mistakes That Distort Reporting Data
Avoid these analytics and measurement traps:
-
❌ Overemphasizing Vanity Stats: Treating total likes or follower counts as primary indicators of business health.
-
❌ Ignoring UTM Parameters: Failing to use consistent tracking links makes attributing web traffic back to specific posts impossible.
-
❌ Evaluating Posts in Isolation: Judging long-term strategy on individual post spikes rather than analyzing monthly or quarterly trends.
-
❌ Failing to Connect CRM Data: Measuring lead volume without verifying whether those leads convert into paying customers.
To explore how structured scheduling keeps content distributed consistently across channels, check out our framework for monthly content planning.
Simplifying Data Analysis with Social Auto Post
Tracking performance across multiple networks can quickly become fragmented. Social Auto Post centralizes content planning, scheduling, multi-platform publishing, and analytics into a single workflow.
Key capabilities include:
-
Structured Content Calendars: Map campaign schedules visually to align publishing with broader business goals.
-
Workflow Coordination: Ensure content quality, messaging accuracy, and proper tracking implementation before publishing.
Optimize Your Social Measurement Strategy
Transform raw platform data into clear marketing insights:
-
Learn How to Execute Monthly Content Planning for Better Tracking
-
Discover How to Repurpose Winning Assets into High-Converting Social Posts
Frequently Asked Questions
What are the most important social media metrics for businesses?
The most critical metrics depend on your goals, but performance-focused businesses should generally track engagement rate, click-through rate, referral traffic, conversion rate, customer acquisition cost (CAC), and overall social media ROI.
Are vanity metrics like likes and followers completely useless?
No. Likes and follower growth serve as helpful diagnostic indicators for brand awareness and messaging resonance, but they should be connected to conversion and revenue data to prove business value.
What social media metrics should be included in executive reports?
Executive dashboards should focus primarily on commercial outcomes, such as qualified lead volume, customer acquisition costs, attributed pipeline revenue, and overall campaign ROI, supported by top-level reach data.