🚨 Introduction: The Data Illusion
When you open a social dashboard, you are immediately surrounded by numbers:
- Likes 👍
- Impressions 👀
- Followers 👥
- Reach 📡
At first glance, these figures can feel meaningful. However, that impression is often misleading.
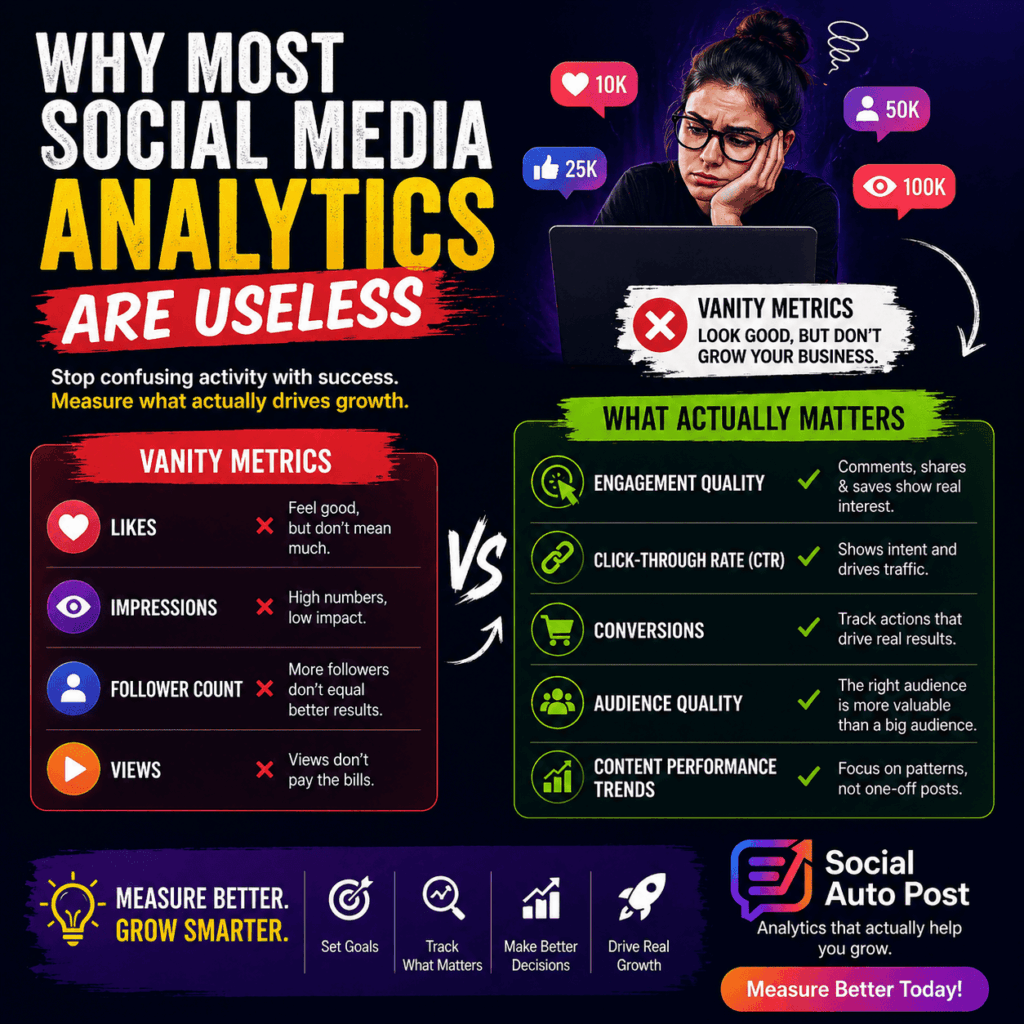
👉 In reality, most social media analytics do not help you grow your business.
Instead, they create a sense of progress without actually improving results.
❌ The Problem: Vanity Metrics Everywhere
Across most platforms, the easiest data to measure is often the least useful.
These are commonly known as vanity metrics.
Common examples include:
- Likes
- Follower count
- Impressions
- Views
Although they look impressive in reports, they rarely explain real performance.
For example, they fail to answer important questions such as:
- Are we reaching the right audience?
- Are users taking meaningful actions?
- Is this content driving real business value?
As a result, teams often focus on visibility rather than impact.
🤔 Why These Metrics Are Still Used
Even though their limitations are well known, vanity metrics are still widely used.
Firstly, they are easy to access since platforms provide them instantly.
Secondly, they feel rewarding. More likes can create a sense of success, even if no real growth is happening.
In addition, they simplify reporting, which makes them attractive in performance reviews.
Finally, they avoid deeper analysis, because meaningful insights require more effort and interpretation.
💸 The Real Cost of Poor Analytics
When teams rely too heavily on weak metrics, the consequences build up over time.
As a result, they often:
- 🚫 Optimize for attention instead of outcomes
- 🚫 Repeat content that does not convert
- 🚫 Misinterpret performance as success
- 🚫 Slow down actual business growth
Therefore, the issue is not the data itself, but how it is used.
✅ What You Should Track Instead
To improve decision-making, it is better to focus on metrics that lead to action.
💬 Engagement Quality (Not Just Volume)
Rather than counting likes, it is more useful to understand behavior.
Instead, ask:
- Are people commenting in a meaningful way?
- Are they sharing the content?
- Is conversation happening around it?
This provides a clearer picture of real interest.
🔗 Click-Through Rate (CTR)
CTR is often more valuable than reach because it shows intent.
For example:
- High views with no clicks → low interest
- Lower views with strong clicks → high relevance
Therefore, CTR helps separate attention from action.
💰 Conversions
Ultimately, this is where value becomes measurable.
Track actions such as:
- Sign-ups
- Purchases
- Website visits
Without this layer, other metrics lose context.
🎯 Audience Quality
While growth is important, quality matters more.
So instead of only asking “Are we growing?”, also consider:
- Are followers part of the target audience?
- Do they engage consistently?
Otherwise, growth may not lead to results.
📈 Performance Trends
Rather than focusing on individual posts, it is better to zoom out.
Over time, patterns become visible, such as:
- Which topics perform best
- Which formats drive engagement
- Which channels convert effectively
Consequently, strategy becomes more reliable.
🧠 A Better Way to Measure Performance
To simplify your approach, the key shift is this:
❌ Track everything → understand very little
✅ Track what matters → make better decisions
Because of this shift, teams often become more focused and effective.
🛠️ How to Improve Your Measurement Approach
Step 1: Define your goal first 🎯
Before reviewing any data, it is important to clarify your objective.
For example:
- Awareness → focus on engagement quality
- Traffic → focus on clicks
- Conversions → focus on actions
Without this step, analytics lack direction.
Step 2: Match metrics to the goal
Once the goal is clear, select only relevant metrics.
For instance, if the goal is traffic:
Focus on:
- CTR
- Link clicks
- Page visits
However, ignore:
- Likes
- Impressions
Step 3: Reduce unnecessary noise
Although more data may seem helpful, it often leads to confusion.
Therefore, it is better to track only 3–5 key metrics consistently.
Step 4: Build a feedback loop 🔄
After that, use insights to improve continuously:
- First, identify what works
- Then, adjust your strategy
- Next, test improvements
- Finally, repeat the process
As a result, performance improves over time.
Step 5: Focus on trends, not single posts
A single post rarely tells the full story.
However, long-term patterns reveal true performance direction more clearly.
🧪 What Good Analytics Actually Looks Like
Strong systems typically:
- Connect metrics to business goals
- Highlight actionable insights
- Remove unnecessary noise
- Support better decision-making
In contrast, weak systems only display data without context.
⚠️ Where Most Tools Fall Short
Although many tools provide dashboards, they often lack clarity.
For example, they may:
- Show too many unrelated metrics
- Overemphasize vanity numbers
- Fail to suggest next steps
As a result, teams stay informed but not truly guided.
🖼️ Suggested Images (Add for SEO)
Image 1: Dashboard Overview
ALT: social media analytics dashboard showing key performance metrics
Image 2: Funnel Visualization
ALT: social media analytics funnel from views to conversions
Image 3: Trend Graph
ALT: social media analytics performance trends over time
🔗 Internal Links (Important for SEO)
- Social media automation →
/social-media-automation - Marketing strategy guide →
/content-marketing-strategy - Analytics fundamentals →
/marketing-analytics-guide
🌍 External References
🚀 How SocialAutoPost Helps
Instead of overwhelming users with raw data, SocialAutoPost focuses on clarity.
It helps teams:
- Understand performance quickly
- Track meaningful metrics
- Manage campaigns efficiently
- Turn insights into action
📈 What Happens When You Measure Better
When measurement improves, everything else follows.
As a result:
- Decisions become clearer
- Strategy becomes faster
- Effort becomes more focused
- Growth becomes more consistent
🧠 Final Mindset Shift
Ultimately, data alone is not enough.
👉 Insights combined with action create real results.
So instead of asking:
“How many likes did we get?”
It is better to ask:
- What worked?
- What didn’t?
- What should we improve next?
🔚 Final Thoughts
In conclusion, social media analytics should simplify decision-making—not complicate it.
Therefore, focus less on volume and more on meaning.
That is where real growth begins.
💬 CTA: Focus on What Matters
If your analytics feel overwhelming but not useful, it may be time to change your approach.
Use SocialAutoPost to turn raw data into clear decisions—and clear decisions into growth.